
In this article, we will explain how to use the JDBC driver from CData to access BigQuery data from EspressReport ES and visualize it. CData Software offers about 250 types of various JDBC Drivers that can connect to BigQuery, Dynamics 365, JIRA, etc.
By using these various JDBC drivers and the Data Registry Manager in EspressReport ES, you can access data from all kinds of data sources in the Cloud and SaaS applications for robust reporting and visual analytics.
Driver Preparation
First download the installation package based on different systems such as Windows, Linux and Mac from the URL below.
https://www.cdata.com/drivers/bigquery/download/jdbc/
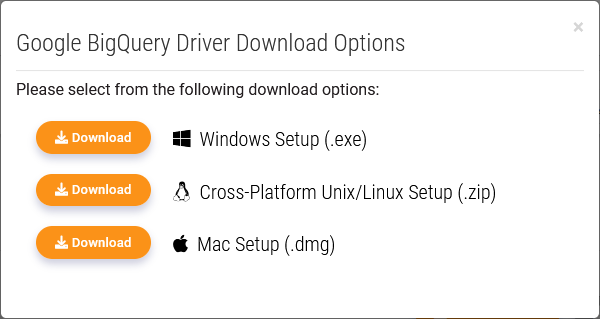
After downloading the installer, proceed with the setup according to the dialogs.

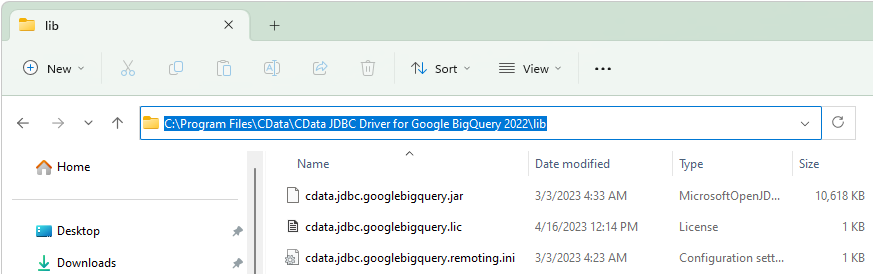
Once the setup is complete, if you choose the default installation directory, the JDBC Driver will be located in “C:\Program Files\CData\CData JDBC Driver for Google BigQuery 2022\lib”. You will find 3 files that you need to use to set up the driver for EspressReport ES.
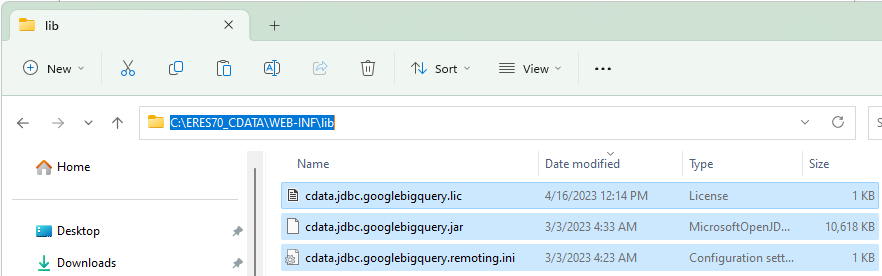
Copy these 3 files from “C:\Program Files\CData\CData JDBC Driver for Google BigQuery 2022\lib” to “<ERES installation>\WEB-INF\lib”.
Connection Steps
Activate Google Cloud BigQuery sandbox
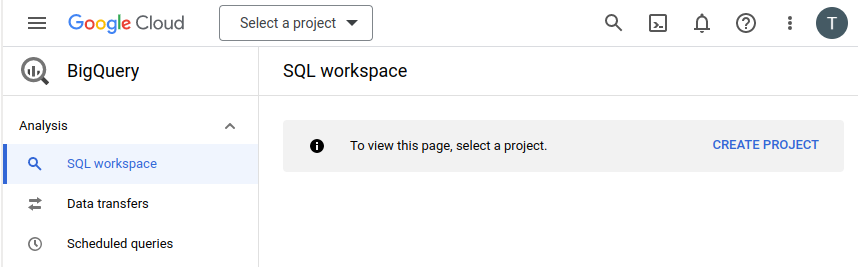
- In the Google Cloud console, go to the BigQuery (Go to BigQuery)
You can also open BigQuery in the Google Cloud console by entering the following URL in your browser: https://console.cloud.google.com/bigquery
The Google Cloud console is the graphical interface that you use to create and manage BigQuery resources and to run SQL queries.
- If you’re not logged into a Google account in your web browser already, you will have to authenticate using an existing Google Account or create a new account.
- On the welcome page, do the following:
- For Country, select your country.
- For Terms of Service, select the checkbox if you agree to the terms of service
- Optional: If you are asked about email updates, select the checkbox if you want to receive email updates.
- Click Agree and continue.

Click CREATE PROJECT.
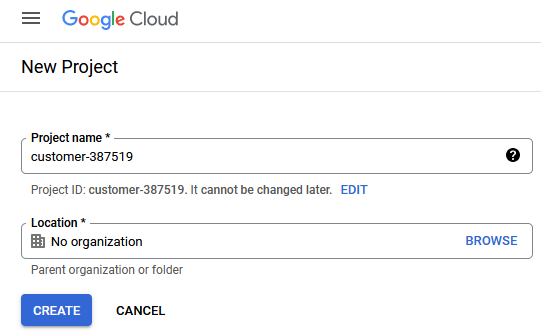
On the New Project page, do the following:
- For Project name, enter a name for your project.
- For Organization, select an organization or select No organization if you are not part of one.
- If you are asked to select a Location, click Browse and select a location for your project.
- Click Create. You are redirected back to the BigQuery page in the Google Cloud console.
You have successfully enabled the BigQuery sandbox. A BigQuery sandbox notice is now displayed on the BigQuery page:

Add dataset to your BigQuery Project
Click on 3 dots and then on “Create dataset”:

And then fill in according to your region and the name you want, for our example let’s use “Covid” because our data will be related to it and click “Create Dataset”.

Add data to your BigQuery Dataset
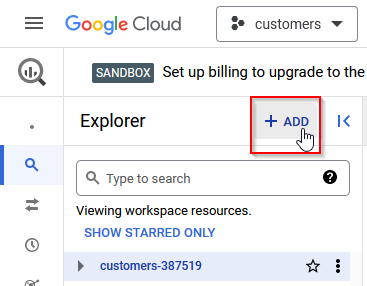
Click on your created project or dataset and then on “Add”.
Then download our sample data source from url: https://drive.google.com/uc?export=download&id=1T1loDQ_5MNvjLjYPmhhb-ZmqCQrXV7LK and select “Local file” and fill in as follow and click on “Create Table”:

Test connection with CData Testing Tool
o open the connection test window provided by CData, double click on the cdata.jdbc.googlebigquery.jar package within the directory where the driver is installed.
Configure the parameters as follows:
| Configuration Items | Values |
|---|---|
| Auth Scheme | OAuth |
| Project ID | Your Project ID on Google Cloud (see the previous paragraph on how to get your Project ID) |
| Initiate OAuth | GETANDREFRESH |
| Dataset ID | The name of the dataset you have chosen. In our example above, we have used the Dataset ID “Covid” (without the quotes) |
| Destination Table | It’s a temporary table where larger Query will be stored temporarily, make sure you put any other name than the name of your TABLES otherwise it will overwrite the data in them. |
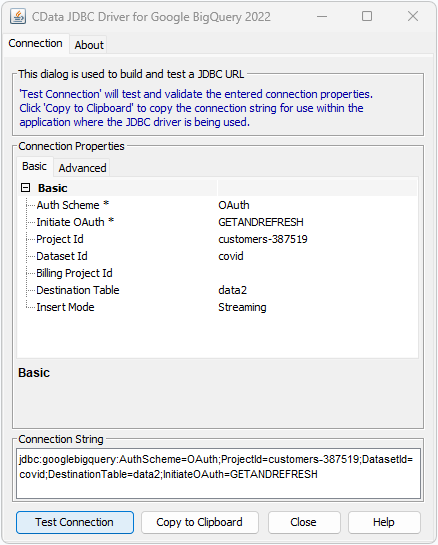
Clicking on “Test Connection” will automatically open the OAuth authorization webpage. You will need to agree to authorize and save your account information for a successful connection. For more detailed information, refer to the document at: https://cdn.cdata.com/help/DBH/jdbc/RSBGoogleBigQuery_c_OAuth.htm
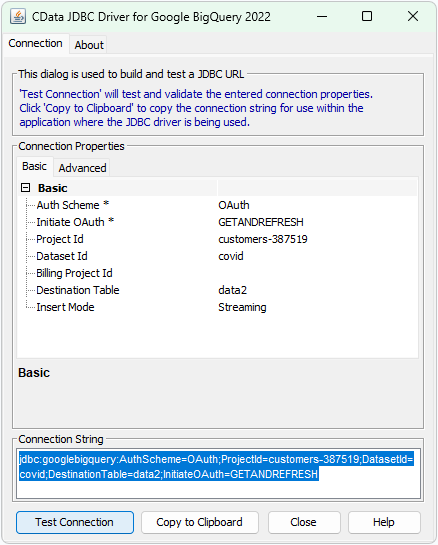
After successfully testing the connection, you should copy the information from the Connection String, which is required for connecting in ERES. Here’s an example of the String: jdbc:googlebigquery:AuthScheme=OAuth;ProjectId=customers-387519;DatasetId=covid;DestinationTable=data2;InitiateOAuth=GETANDREFRESH
Start ERES Organizer
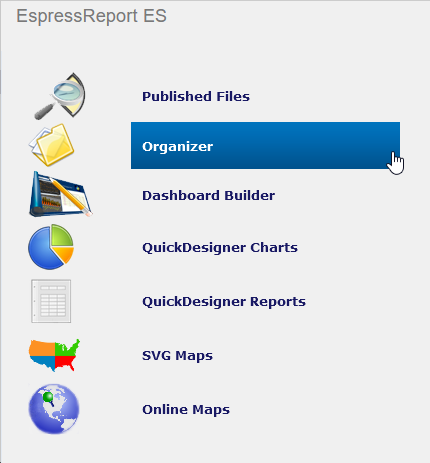
Let’s create a report based on BigQuery data with EspressReport ES. EspressReport ES uses a tool called Organizer to manage and visualize connection information. Log in to the management screen of EspressReport ES.

Select “Organizer” from the left menu.
The Java executable file will be downloaded as shown below, so launch it.

Add Data Source
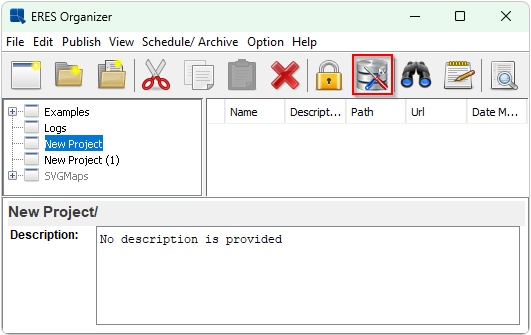
After launching ERES Organizer click on “Data Registry Manager”.
Click the Add button.
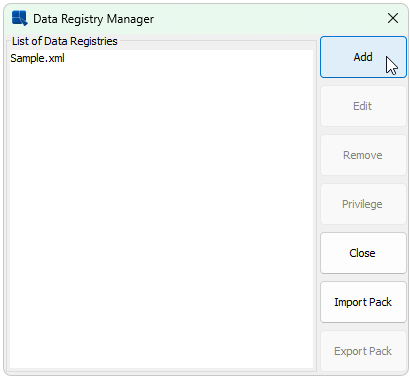
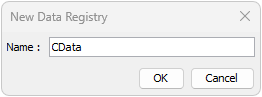
Create a Data Registry with a name of your choice and click “OK”.
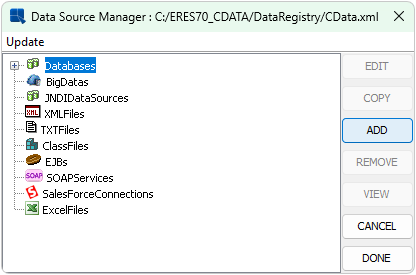
After creating the Data Registry, select Databases and click ADD.
Configure the parameters as follows:
| Configuration Items | Values |
| Name | Any name |
| Driver List | Other |
| URL | Your Connection String from CDATA test tool (see the “Test connection with CData Testing Tool” paragraph on how to get your Connection String) |
| Driver | cdata.jdbc.googlebigquery.GoogleBigQueryDriver |
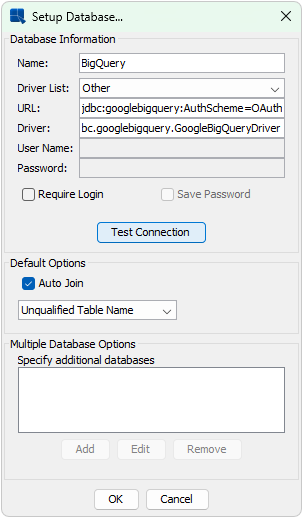
Click “Test Connection” if you have set everything up correctly the following message will appear.

Add Queries
After adding the connection to BigQuery select Queries under BigQuery connection and click the “ADD” button.

Enter the name of your choice and define a query using “Enter SQL statement”.
The CData driver for BiqQuery supports Query Builder as well even though in our example here, we make the query with a SQL statement.

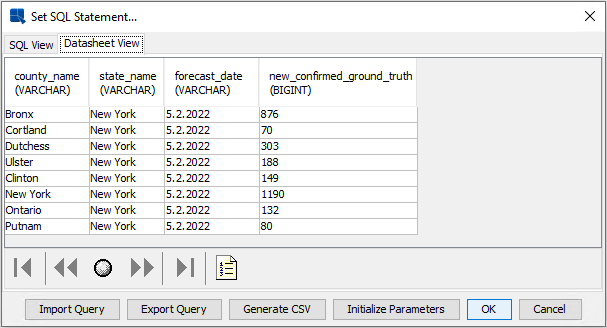
Enter your SQL statement:
SELECT county_name, state_name, forecast_date, new_confirmed_ground_truth
FROM data
WHERE state_name = 'New York';
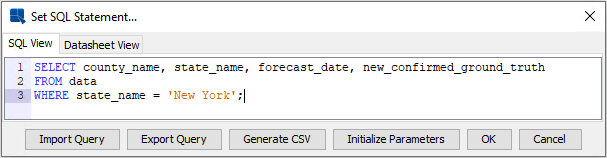
You can check the actual result by moving to the “Datasheet View” tab. After you check it, press “OK”
Create a report
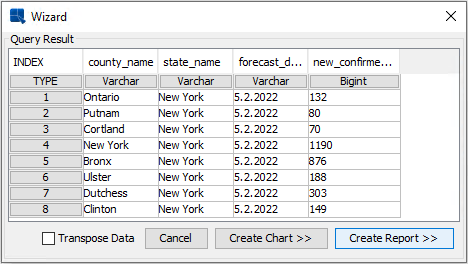
After creating a query, create a report based on the results of that query. Select the target query and click “VIEW”.

A wizard will be displayed as shown below, so select “Create Report”.
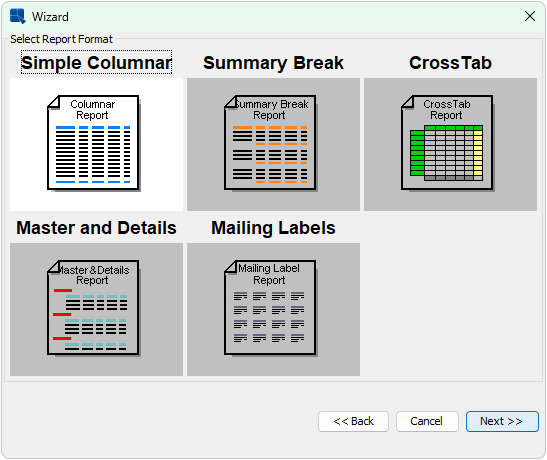
Select the Simple Columnar Report format.
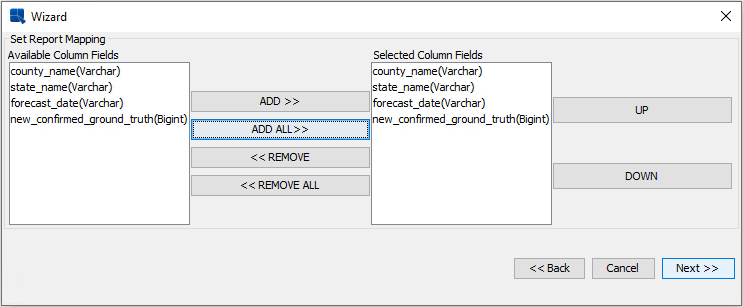
Proceeding to the next page, set Report mapping.
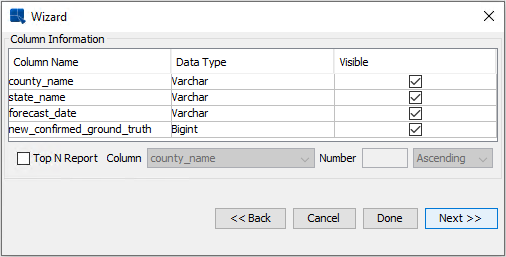
Proceeding to the next page, set Column Information.
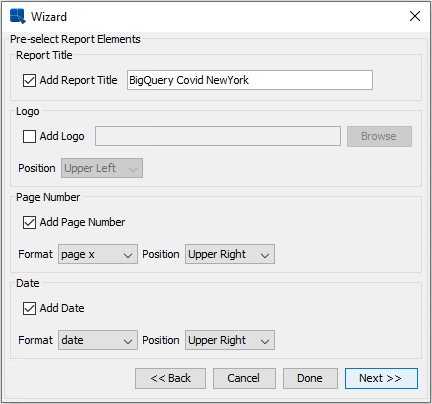
Proceeding to the next page, Pre-select Report Elements.
Proceeding to the next page, select Report Style and click “Done”.

Now you can see your created Report in designer mode.
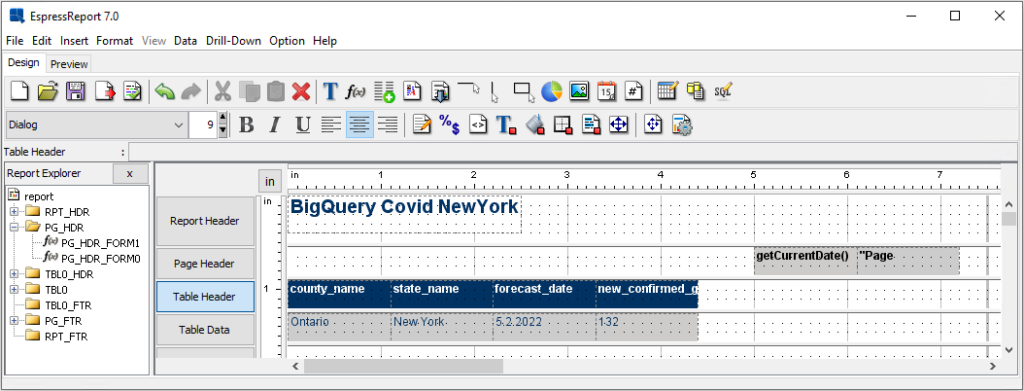
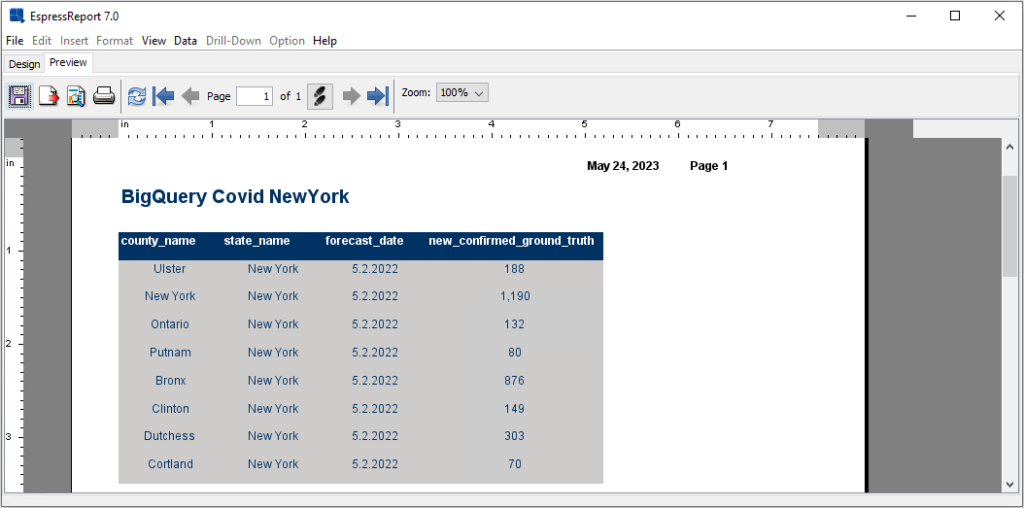
On the top left you can switch to the Preview window to see what the resulting report will look like.
Click on Preview.
Conclusion
By using the CData JDBC Driver in this way, you can easily access many data sources in EspressReport ES.