
Quadbase products allow users to create charts, reports or maps and publish them either separately or group them in dashboards.
All these templates can be created either manually via our GUI applications or programmatically in Java code via our API.
We have internal support for a wide variety of data sources, but since our products can use Java objects as data sources, virtually anything can become a data source for our products.
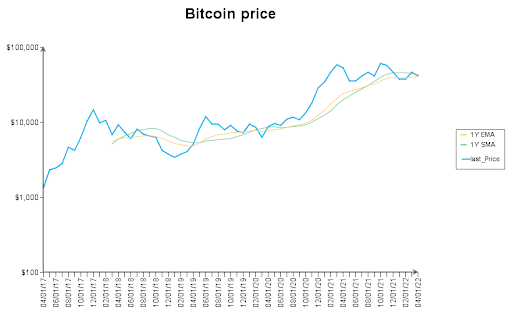
In this article, we will create a Bitcoin/USD price chart, we will aggregate the data using our “time zooming” feature, we will add a moving average to the chart and we will export that chart to a file. All using the Quadbase ERES API, without using any templates.
For this example the chart data will be obtained from a free public REST API in the JSON format.
Note: for simplicity, the code in this article doesn’t handle exceptions. The code is working but if you want to use this code for your projects, we recommend adding exception handling.
The classpath:
Java JDK 8+ – We used the Oracle Java, but you can use your preferred Java as well
ERES 7.0 You can download the evaluation version for free on www.quadbase.com
NOTE: All Quadbase products (EspressChart, EspressReport, EDAB and ERES) contain the same charting engine. We chose ERES for this example because it has the json.jar library included by default.
From ERES 7.0, we will need these jars:
ERESOrganizer.jar – contains the Quadbase charts engine (among other things)
json.jar – Java tools for parsing JSON
qblicense.jar – Your Quadbase license. You can use the evaluation license too.
First we need to obtain the data from the API URL. We just create a buffered reader and read the output obtained from the URL into a StringBuffer.
Please note that we are obtaining hourly Bitcoin price in USD for the past 1825 days, so we will receive a lot of data.
URL apiurl = new URL("https://api.coingecko.com/api/v3/coins/bitcoin/market_chart?vs_currency=USD&days=1825&interval=hourly");

BufferedReader in = new BufferedReader(new InputStreamReader(apiurl.openStream()));

StringBuffer sb = new StringBuffer();

String inputLine;
while ((inputLine = in.readLine()) != null) {
    sb.append(inputLine);
}
in.close();
The data obtained from the server come in the JSON format. Now we need to parse the JSON data and add them to a Java array. We will be using some tools from the json.jar file plus some very basic Java tools.
// convert the String response to JSON objects
JSONObject myjson = new JSONObject(sb.toString());
JSONArray data_array = myjson.getJSONArray("prices");

//We want time/date data in a format that is understood by new Date(time/date); constructor that is used in our products internally. This is why we need to add the following line:

SimpleDateFormat formatter = new SimpleDateFormat("yyyy-MM-dd hh:mm:ss");
Then we just iterate the JSON objects. It is a two dimensional array. Although the data types for this particular data source are not String but a Unix timestamp (for time and date) and a number (for the price), we will store the values in a two dimensional String array. Our products will parse the data into the correct formats automatically.
String[][] listdataarray = new String[data_array.length()][2];
for (int i = 0; i < data_array.length(); i++) {
    JSONArray rowItem = data_array.getJSONArray(i);
    if (rowItem != null) {
        for (int j = 0; j < rowItem.length(); j++) {
            switch (j) {
            case 0:
                // convert the Unix timestamp to a Java Date format
                Date tempdate = new Date(rowItem.getLong(j));
                listdataarray[i][j] = formatter.format(tempdate);
                break;
            case 1:
                listdataarray[i][j] = rowItem.getString(j);
                break;
            }
        }
    }
}
We have our data source almost ready. The only things remaining are to set up the data types and the column names.
This is done using one-dimensional Java String arrays.
We can begin with the data types. For our data source, the first column contains a timestamp and the second column contains a number. So we will choose the “timestamp” and “double” Java data types.
// set data types
// timestamp for the date/time
// double for the price
String[] dataTypes = {
        "timestamp", "double"
};


We can also set the column names. These can be shown in the resulting charts (or they can be hidden).

//set column names
String[] fieldNames = {
        "Datetime", "Price"
};
Now we have the data source prepared so we can start creating the chart using the Quadbase tools from the ERESOrganizer.jar library.
// no EspressManager server needed, we'll just render the chart
QbChart.setEspressManagerUsed(false);
QbChart chart = null;

// we'll just export the chart, skip the initialization of the GUI
QbChart.setForExportOnly(true);

// create the data source from the arrays we've prepared
DbData dbData = new DbData(dataTypes, fieldNames, listdataarray);

// set the chart column mapping
// 0 = first column (timestamp) will be used for the chart series (aka "X axis")
// 1 = second column (price) will be used as the chart category (aka "Y axis")
// -1 = do not set any other categories, not needed for a simple Line chart
ColInfo colInfo = new ColInfo(0, 1, -1, -1);

// initialize 2D line chart using our data source
chart = new QbChart((Applet) null, QbChart.VIEW2D, QbChart.LINE, dbData, colInfo, null);

// set the chart size in pixels
Dimension canvasSize = new Dimension(1000, 600);
chart.gethCanvas().setSize(canvasSize);

// Set the chart title
chart.gethMainTitle().setValue("Bitcoin price");

// set set Y axis options - Bitcoin price in USD
// automatic scale and origin of the Y axis
chart.gethYAxis().setScaleAutomatic(true);
chart.gethYAxis().setOriginAutomatic(true);

// Y axis will display the price, so we'll format it as a "currency" and add the dollar sign
NumericFormat nf = new NumericFormat();
nf.setFormat('$', false, 0, 0, 0, 0, '.', ',', false);
chart.gethYAxis().setLabelFormat(nf);

// Log(10) scale is better for displaying price (important details don't get lost)
// Enable log scale for the Y axis and set the log base to 10
chart.gethYAxis().setLogScale(true);
chart.gethYAxis().setBaseForLog(10);

// X axis options - Time and Date of the price
DateTimeFormat dtf = new DateTimeFormat();
dtf.hideTimestampTime = true;
chart.gethXAxis().setLabelFormat(dtf);

// display every 2nd label (every other month)
chart.gethXAxis().setLabelStep(2);
Since we obtained hourly data for the past five years, we will need to aggregate the data since it is impossible to display all the data in a chart in a meaningful way.
Luckily ERES can do that for us, we just need to enable and set up this feature.
// Time zooming options = we can't display five years of hourly data in a chart
IZoomInfo zi = chart.gethZoomInfo();

// aggregator = average
zi.setAggregateOperator(IZoomInfo.AVG);

// scale = 1 month
zi.setScale(1, IZoomInfo.MONTH);
zi.setZoomEnabled(true);
We have just set up the “time zooming” feature to aggregate the X axis data monthly and calculate the average value for each month. We could also have chosen other aggregation methods like “last” which would display the monthly “closing price” or other aggregation methods.
Now we will add some trendlines. ERES will calculate the trendline from our data so we do not need to specify any new data source. We will add two lines: one year simple moving average and one year exponential moving average.
// add a trendline - simple moving average
IDataLineSet dlines = chart.gethDataLines();
DataLine smaline = new TrendLine2D(chart.getChart());
smaline.setTitle("1Y SMA");
smaline.setLineType(TrendLine.SIMPLE_AVERAGE);
// coefficient = 12 months (units defined in the zooming options = month)
smaline.setCoeff(12);
smaline.setColor(new Color(100,200,150));
dlines.add(smaline);

// add a trendline - exponential moving average
DataLine emaline = new TrendLine2D(chart.getChart());
emaline.setTitle("1Y EMA");
emaline.setLineType(TrendLine.EXPONENTIAL_AVERAGE);
// coefficient = 12 months (units defined in the zooming options = month)
emaline.setCoeff(12);
emaline.setColor(new Color(255,200,100));
dlines.add(emaline);

chart.refresh();

// export the chart to a PNG file
chart.export(QbChart.PNG,"BTCUSD.png");
The chart we just made:
Code example: